Client
Our client is a US analytical agency that collects their customer-companies’ sales & marketing data (e.g. subscriptions, revenue, customers, pricing metrics), user behavior data (pageviews, articles, conversions, and other actions on the site), then prepares analytical reports as well as forecasts to increase target KPIs.
They operate across various business domains: Telecom, Retail & eCommerce, Media and Entertainment, Education, Fintech, Healthcare, HVAC, Sports, and many more.
Challenge
The demand for the client’s services was increasing number of projects. However, the processes of project onboarding and management — including accessing, collecting, and analyzing customer data, preparing reports, and choosing scripts/algorithms for data processing — were completely manual.
To increase team bandwidth, bypassing recruiting new employees from the local market, the client contacted Lightpoint to develop a custom Cloud-based system to automate a wide range of processes.
Project Description
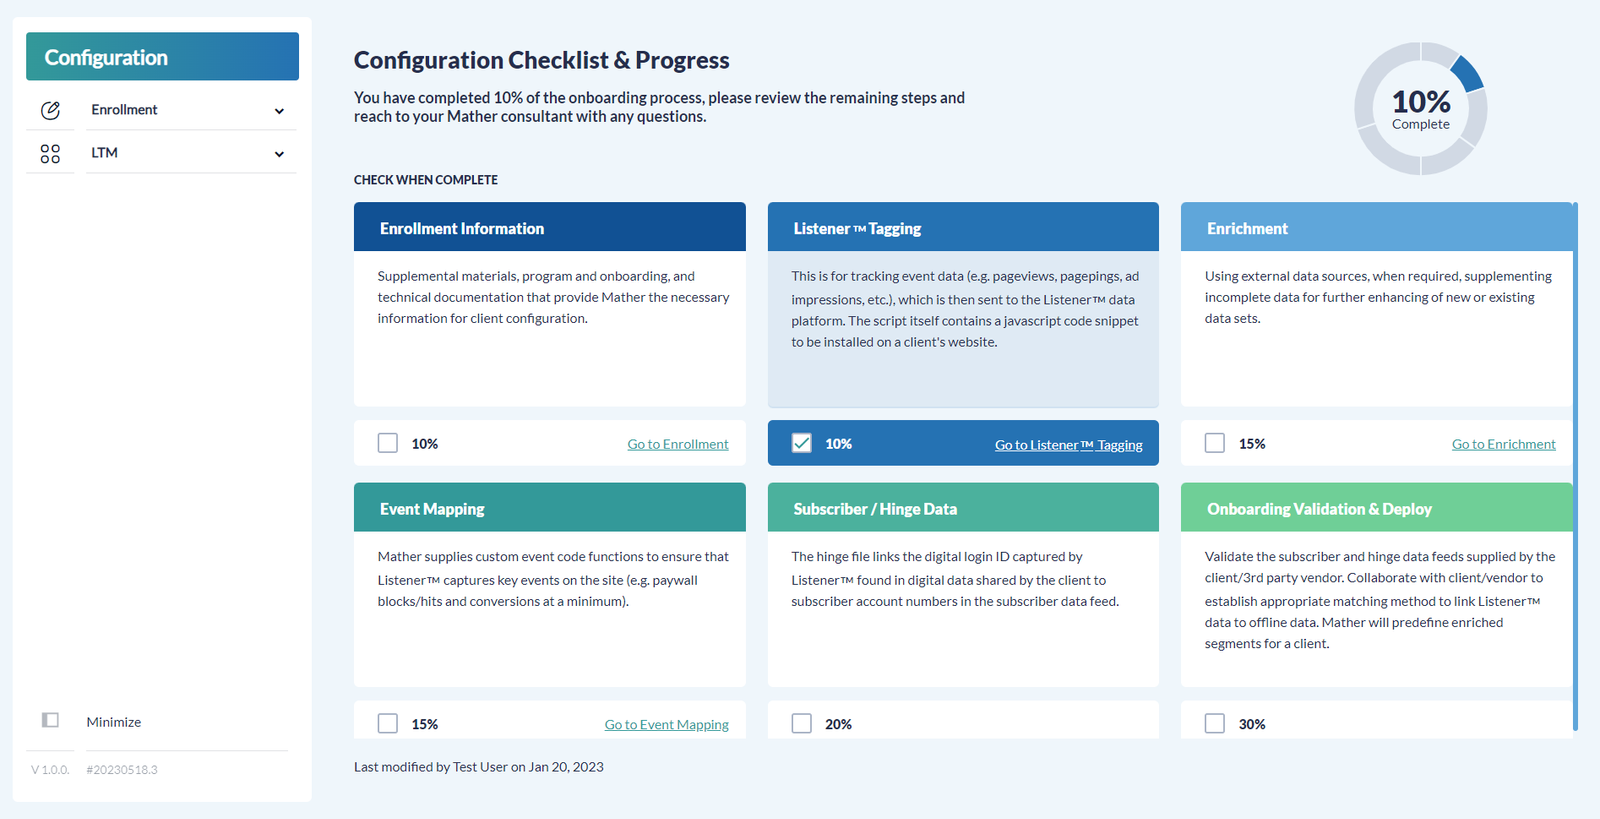
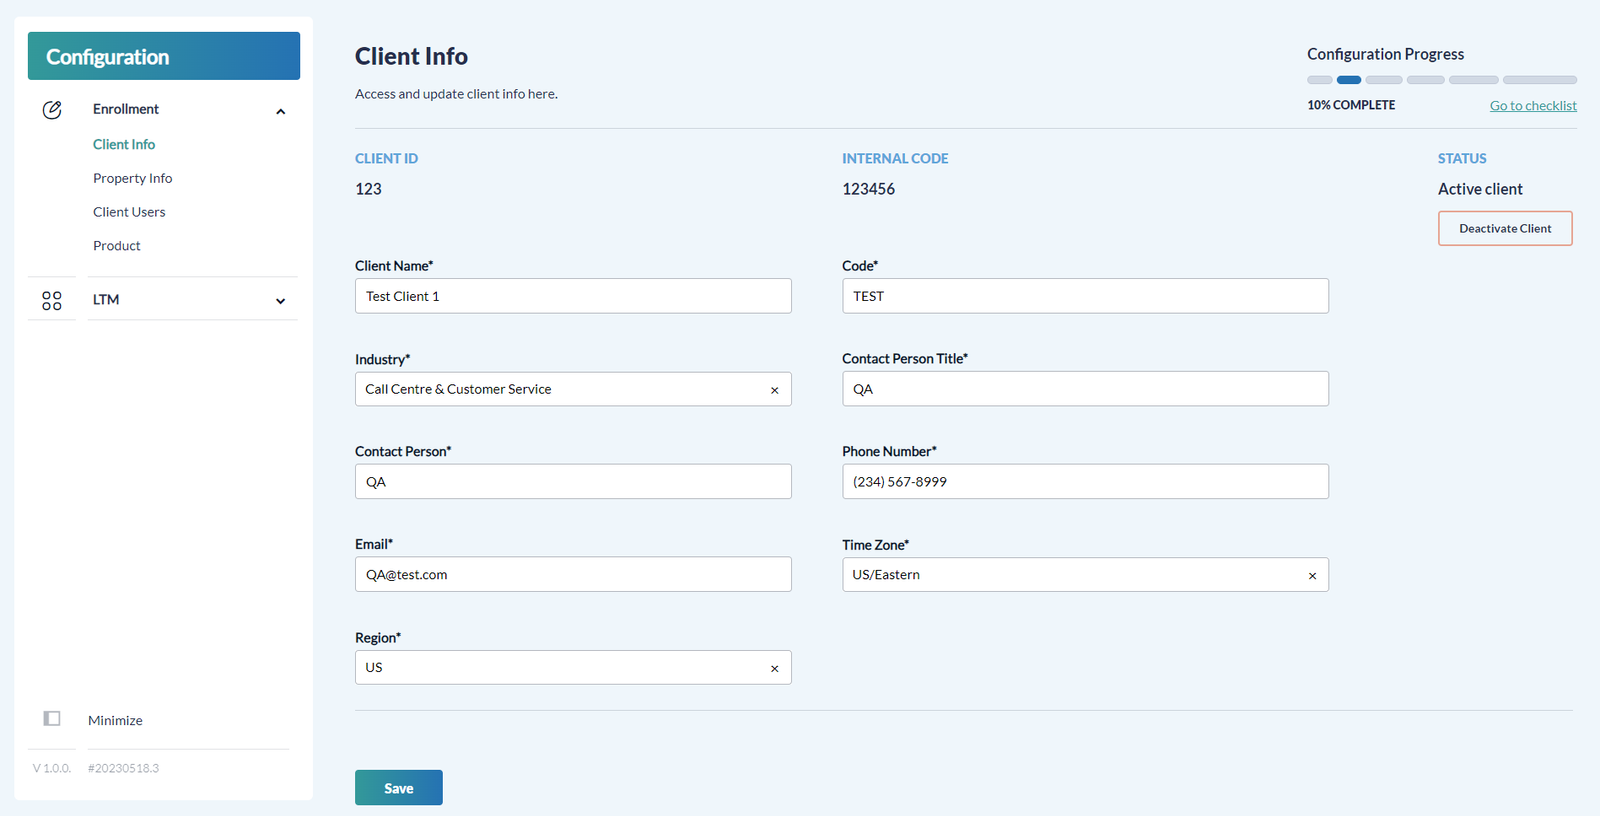
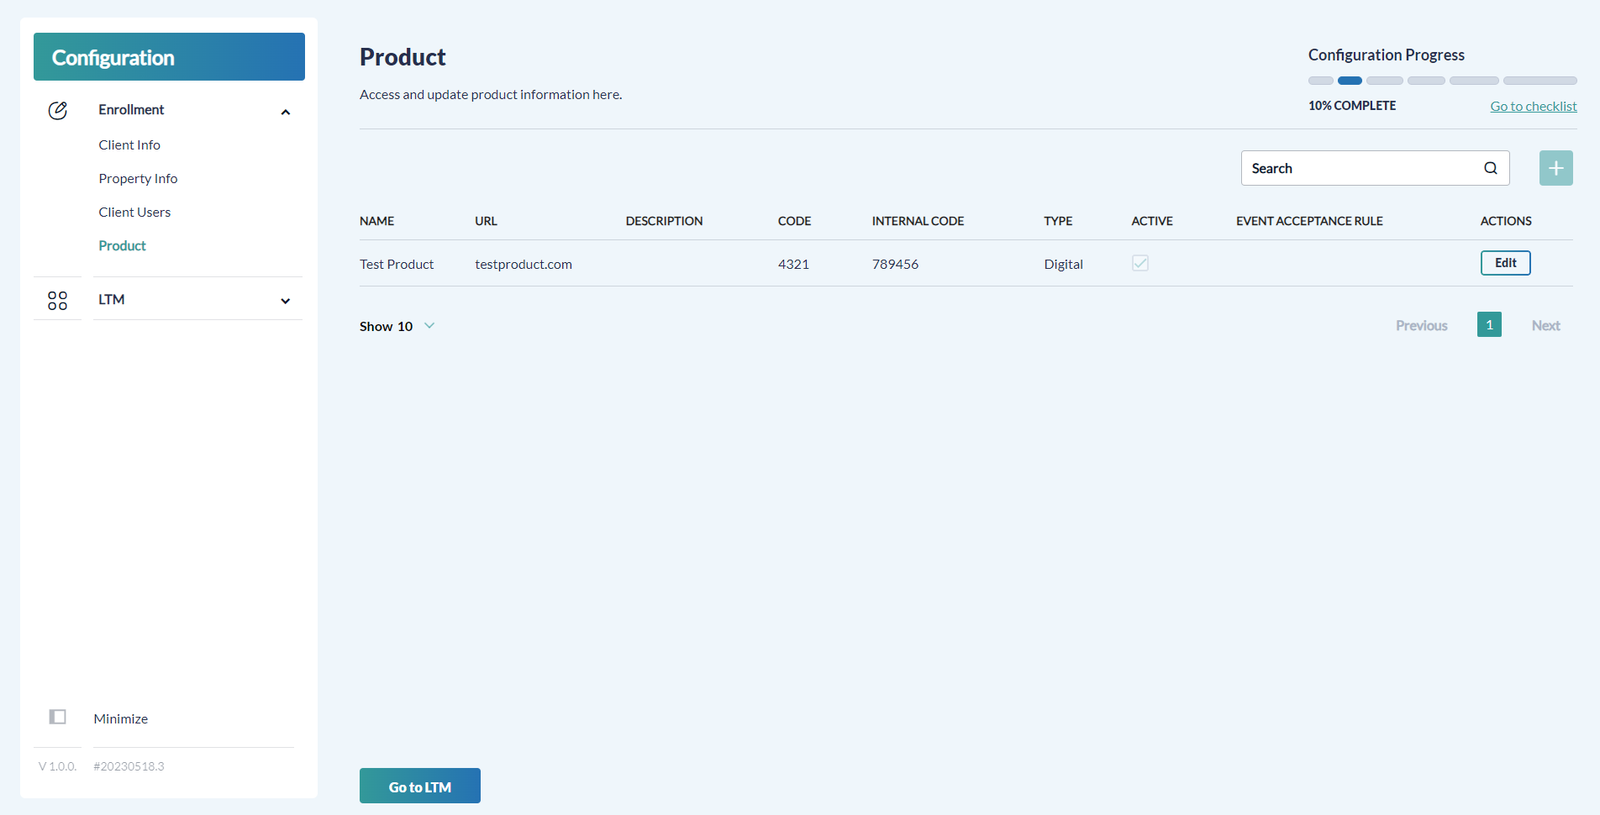
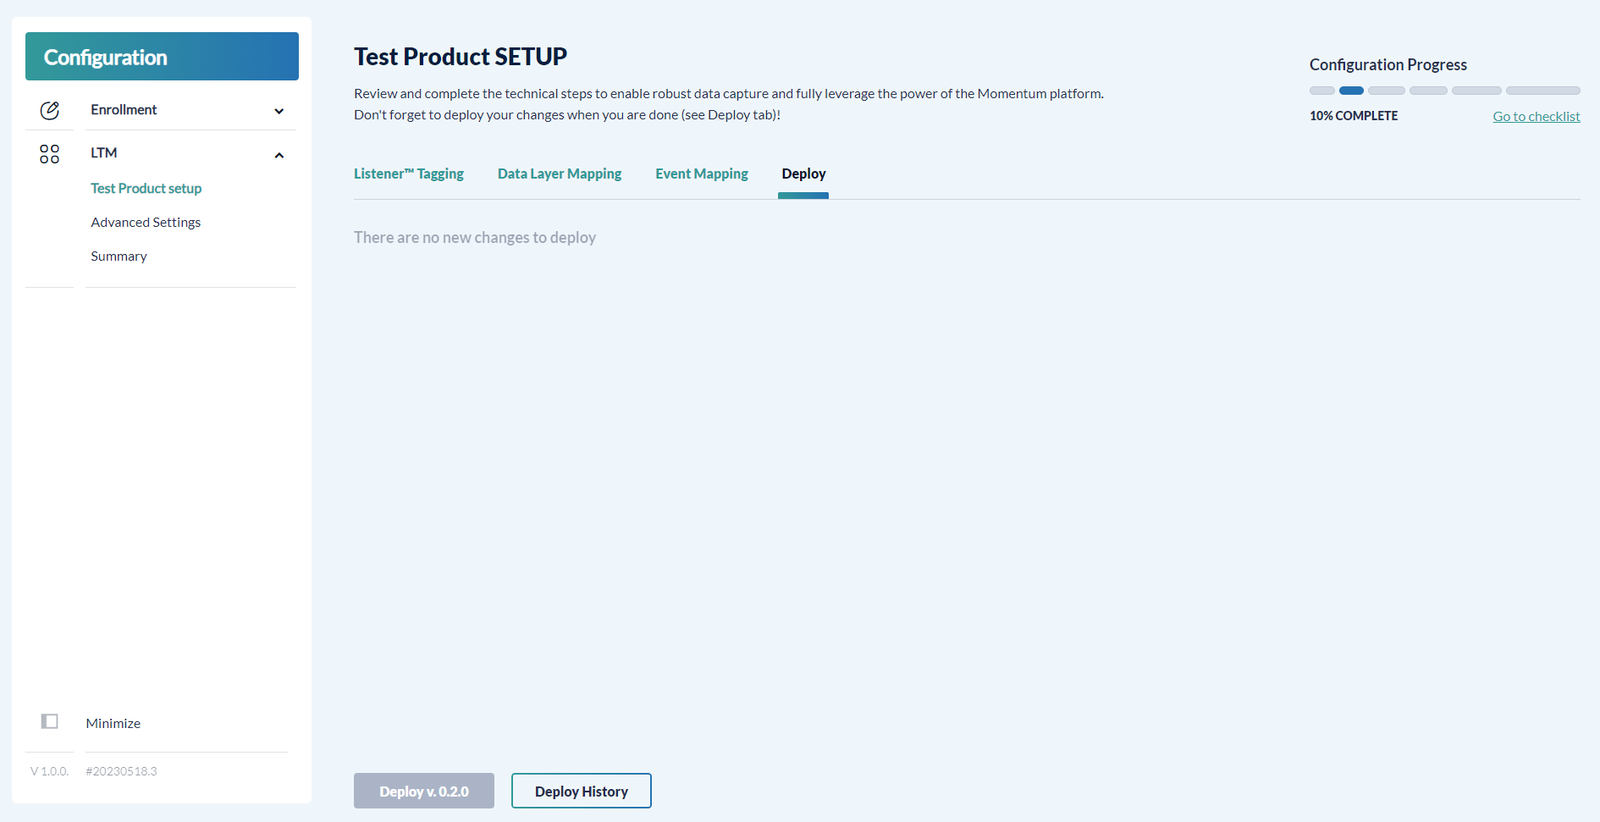
Part 1: Development of a Self-service portal (SSP)
We developed a web portal that allowed client employees to manage all their customers via a centralized interface, in particular:
- perform project onboarding
- setup configuration of data analytics: what data to collect, how to map it, transform and process
- communicate with customers
Besides the employees, the customers also got access to the interface to track the project progress and make changes to the configuration if needed. That was done to increase customers’ autonomy, promptness when applying changes, and save employees’ time.
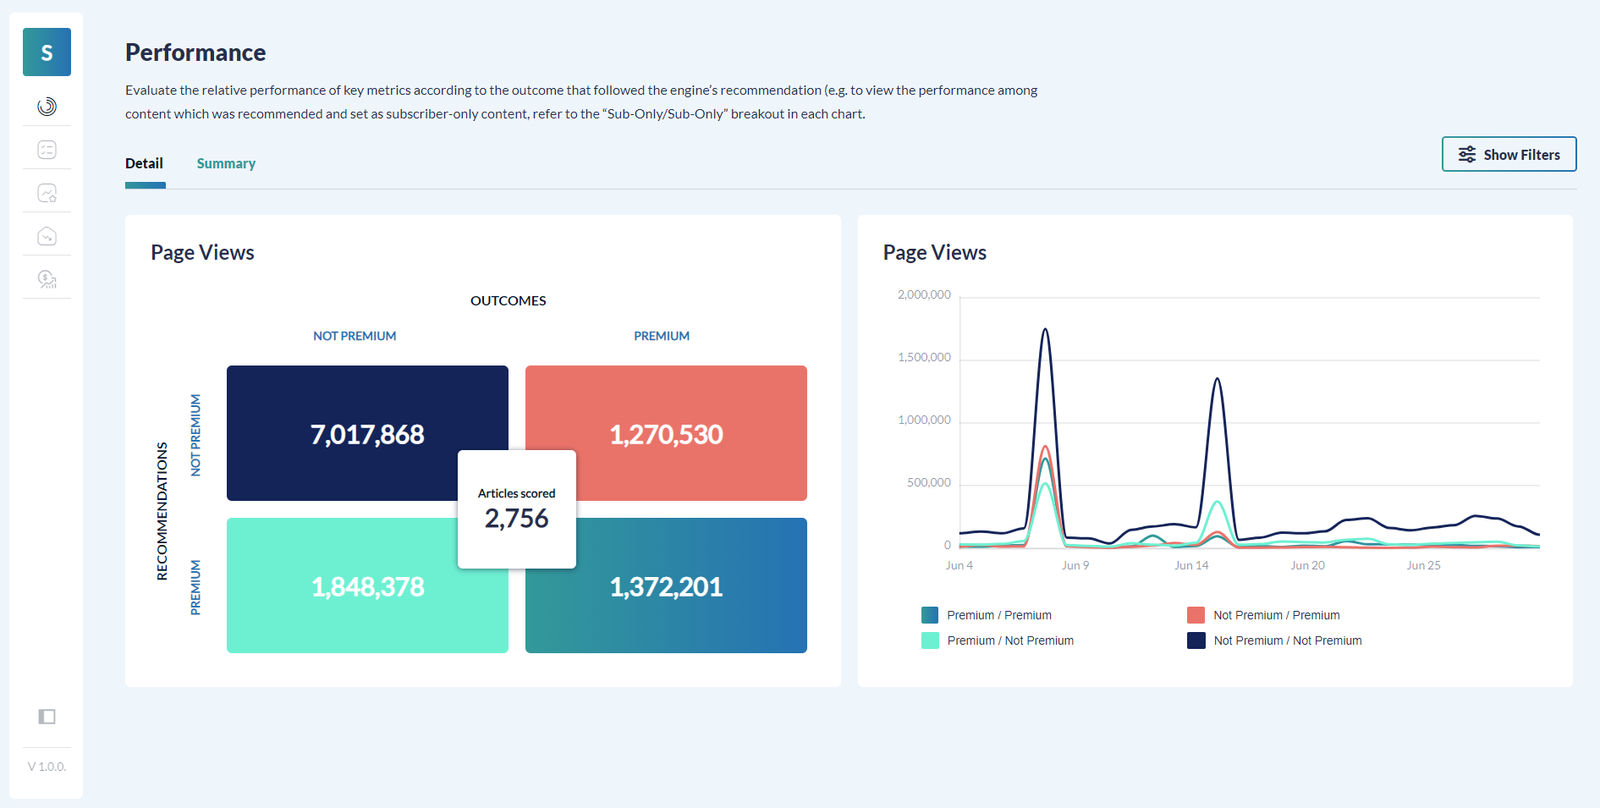
The SSP portal was also responsible for producing analytical reports from the imported customer data. The reporting system comprised a catalog of in-built report types — various graphs, charts, schemas, maps, calculations, tables, documents, etc. Calculation and visualization of the outcomes was completely automated. To compare, previously the client employees used Tableau for that, which required a certain degree of manual manipulations.
Part 2: Development of a back-end platform for data collection and processing
Our client works with different businesses from different industries, so data sources (databases, websites, text docs, cloud repositories, etc) and data structures (format, set of fields, datasets, etc) are also varied. Our task was to implement the mechanism that won’t require code rewriting to enable processing the data of each new client, but only configure data mappings to unify all the data coming.
How the final solution we built works:
Phase 1 – Data collection
The system collects data (static files and website traffic) from source systems regularly in accordance with a schedule. Then the data is converted to a common format and structure and undergoes basic enrichment – grouping related data pieces to make them more detailed and descriptive.
Phase 2 – Data processing
Here a deeper degree of data enrichment takes place, now with metrics that are generated via Data Science algorithms. After several cycles of enrichment, the data becomes ready for analysis, reporting, and visualization.
Additionally, we implemented:
- generation of notifications that inform the user when metric exceeds threshold value
- generation of recommendations based on predictive analysis
- calculation of lost revenue
Phase 3 – Calculations for reporting
The system finally combines all the obtained data and prepares regular insights based on it. The SSP portal ingests these insights and visualizes them for end users.
Key features
Screenshots


Team Composition & Project Duration
It’s an on-going project and up to now it’s duration is 18 months, the Lightpoint team consists of: 5 Back-end developers, 1 QA Engineer, 4 Data Engineers, 1 Business Analyst, 1 DevOps
Major Tech Stack
.NET, NodeJS, Angular, Golang, Python, Kafka, Postgres, Clickhouse, AWS
Result
The project is long-term with a wide roadmap of further functionally, but the major expected result is automation of data analytics processes so that the business can easily scale with no need to hire internal resources and significant cost savings due to hiring a team from Lightpoint.